Your trading history is one of your most valuable assets. It’s a record of your decisions, your strategies, and your progress. But scrolling through endless lines of transaction data can be tedious and uninspiring. What if you could see your entire trading journey unfold visually, right where the action happens?
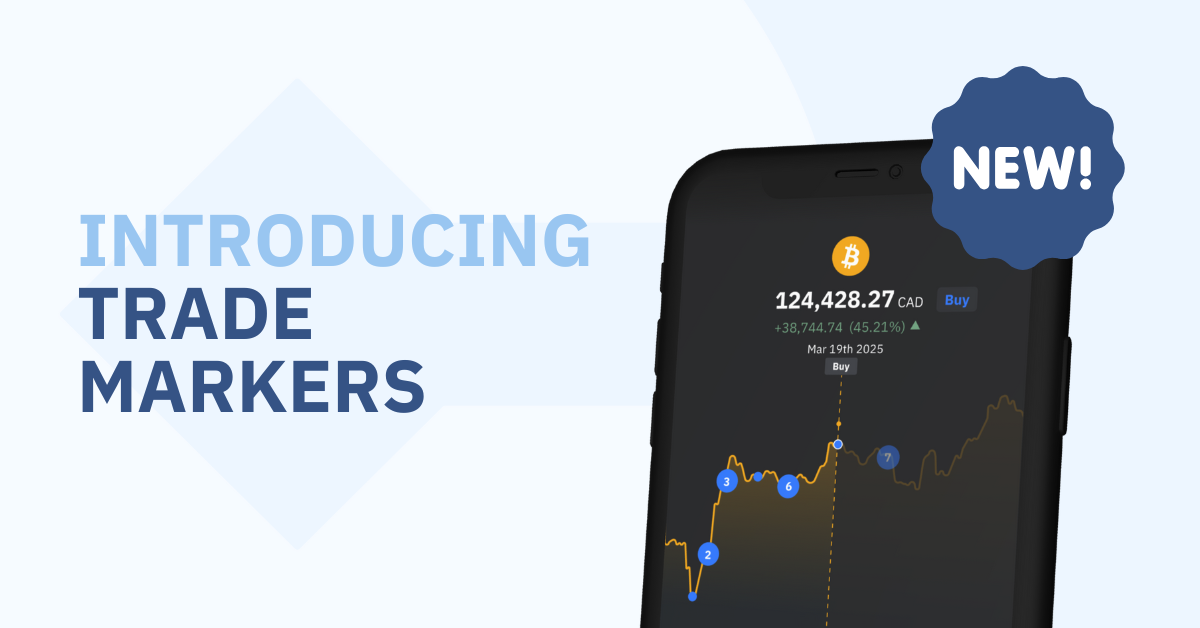
Now you can. We’re excited to introduce Trade Markers, a new feature designed to bring your trading history to life. Trade Markers map every buy and sell you've ever made directly onto the price chart, giving you a clear, personalized view of your activity.
It’s time to stop digging through history and start seeing your story.
Trade Markers are simple, visual tags that appear on your charts at the exact price and date of your trades. This feature transforms your standard price chart into a personalized map of your trading journey.
Instead of trying to connect a list of transactions to price movements, you can now see it all in one place. You can instantly spot where you entered a position, where you took profits, and how your timing aligned with market trends.
Please note that Trade Markers are only available on the Coinsquare mobile app at the moment.
Ready to see your Trade Markers? The feature is already available in your Coinsquare mobile app. Here’s how to use it:
This tool was built to give you additional insights with zero extra effort by making your trade history visual and interactive.
We all have those trades we’re proud of, the ones where we timed the market perfectly. With Trade Markers, you can instantly revisit those moments. See exactly where you bought the dip or sold at the peak, and understand the market conditions.
Not every trade goes as planned, and that’s okay. The most successful traders learn from their mistakes. Trade Markers make it easy to analyze trades that didn’t work out. You can see where you might have entered too early, sold too late, or misread a trend. This visual feedback loop is crucial for spotting weaknesses and improving your approach.
Are you consistently buying during a downturn or selling into strength? Do you tend to exit positions too soon? Trade Markers help you uncover habits and patterns in your trading behavior that might not be obvious from a transaction list alone. Identifying these tendencies is the first step toward building a more disciplined and effective strategy.
Ultimately, this feature makes your trading experience more personal. Your chart is no longer just a representation of the market; it tells your unique story on Coinsquare.
We invite you to explore Trade Markers today. Open a price chart on your Coinsquare app, tap to reveal your past trades, and see what new insights you can uncover. Your trading story is waiting for you.
Have you tried Trade Markers yet? We’d love to hear about your experience! Share your thoughts and any interesting patterns you’ve discovered on social - Coinsquare on X, Coinsquare on Instagram.


